All work
Routing dashboard for Rutby, 2024
Rutby’s dispatchers watched 140 routes on one map and found late vans after customers called.
Role
Senior designer
Team
PM, 5 engineers, analyst
Time
Five months
The decision
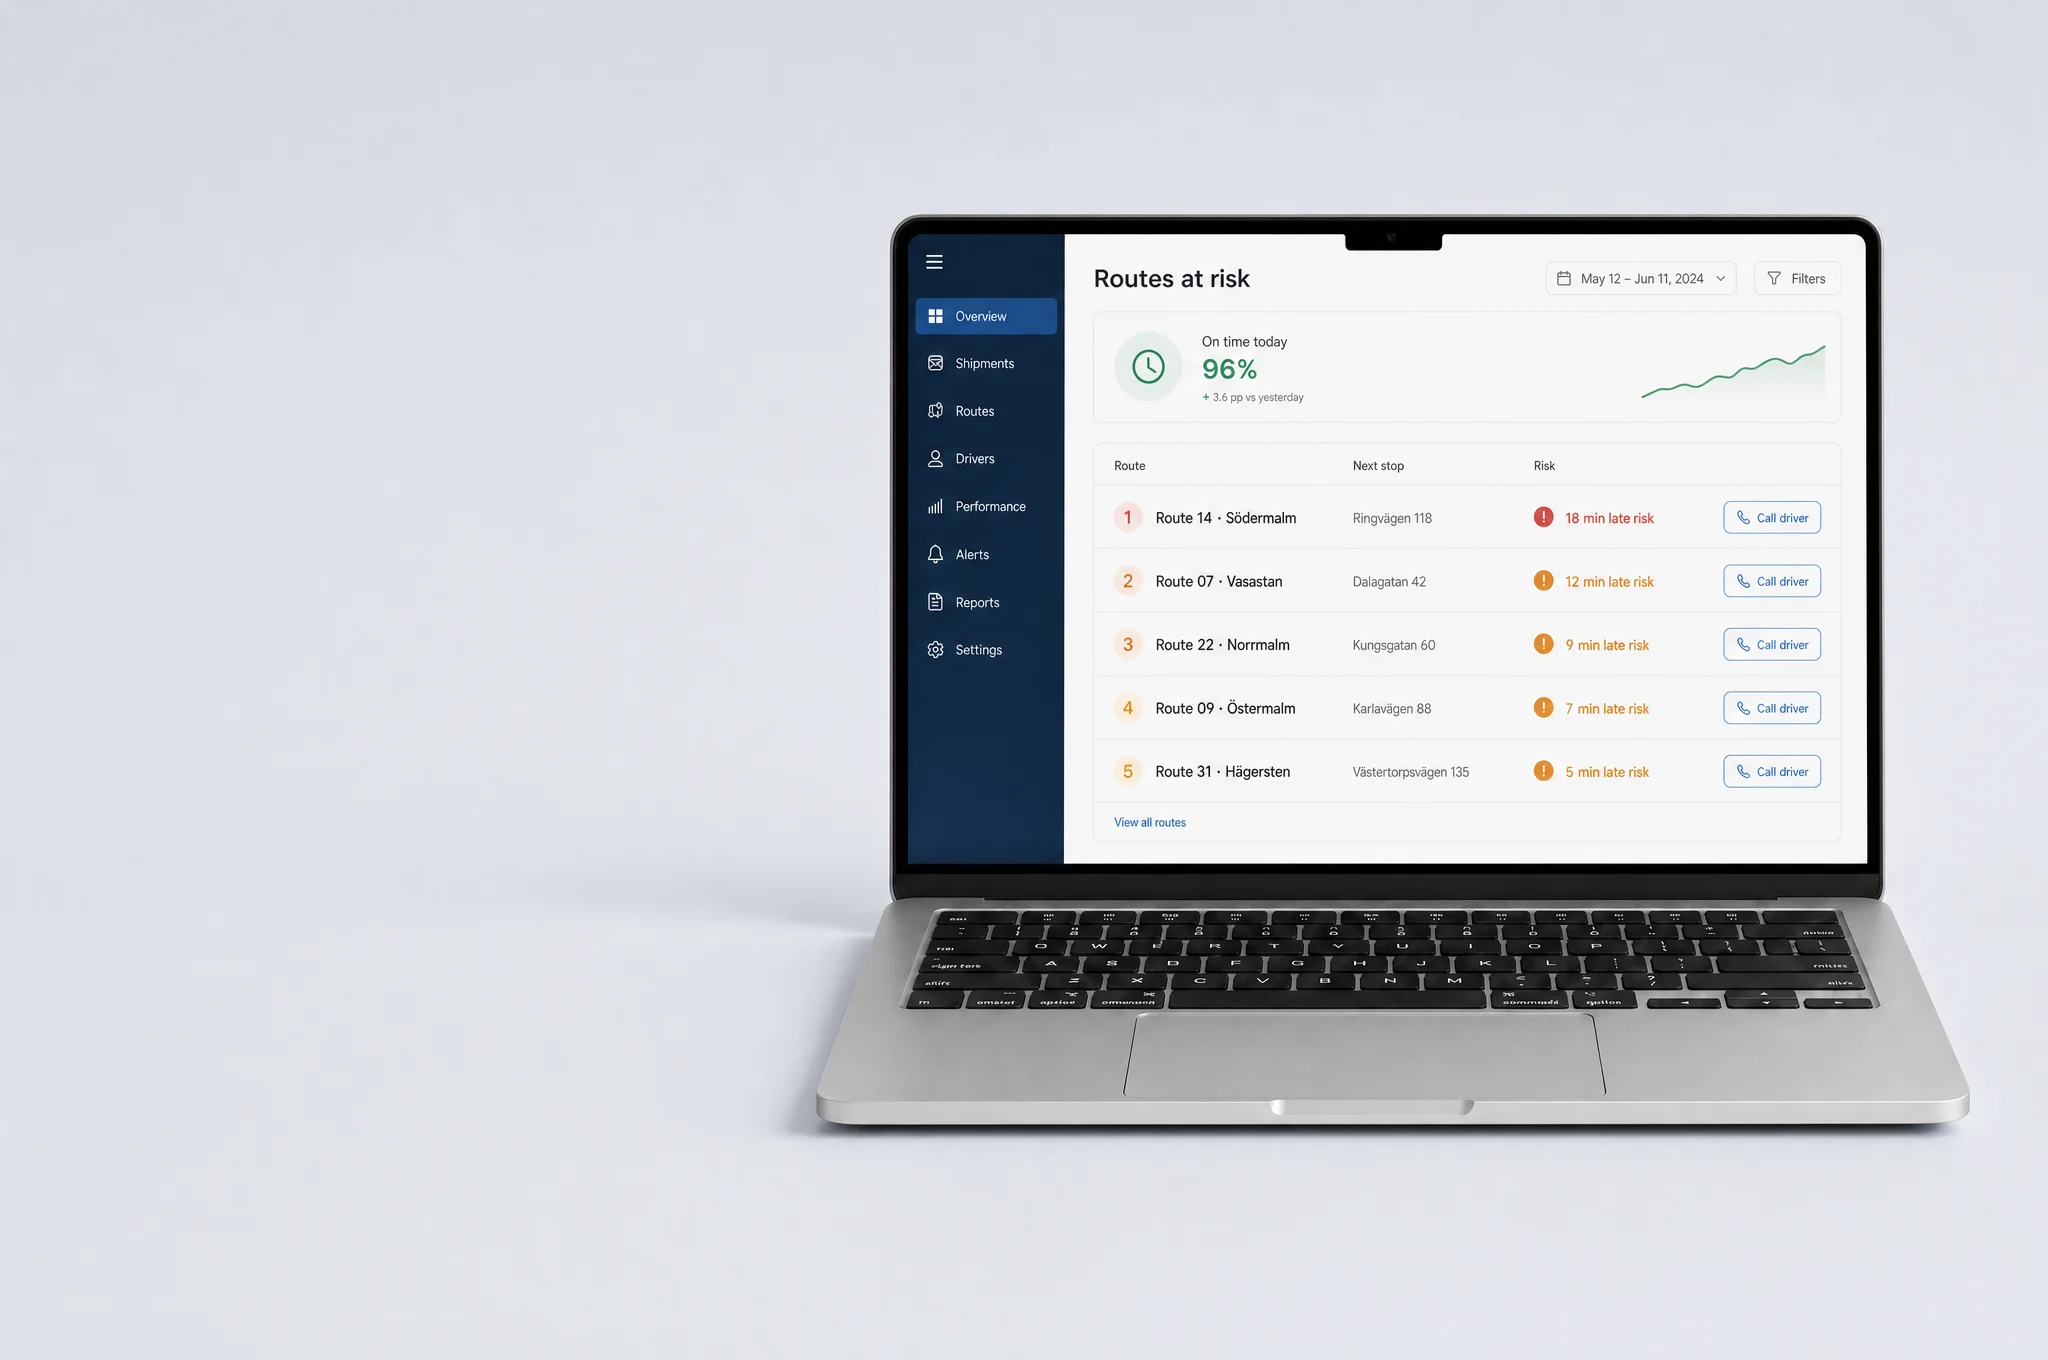
We showed dispatchers the routes most likely to run late first, instead of every route at once.
What it cost
The full route list moved one click away, and two depots asked for it back in the first week.
Questions about this project? I’m happy to walk you through it.
The problem
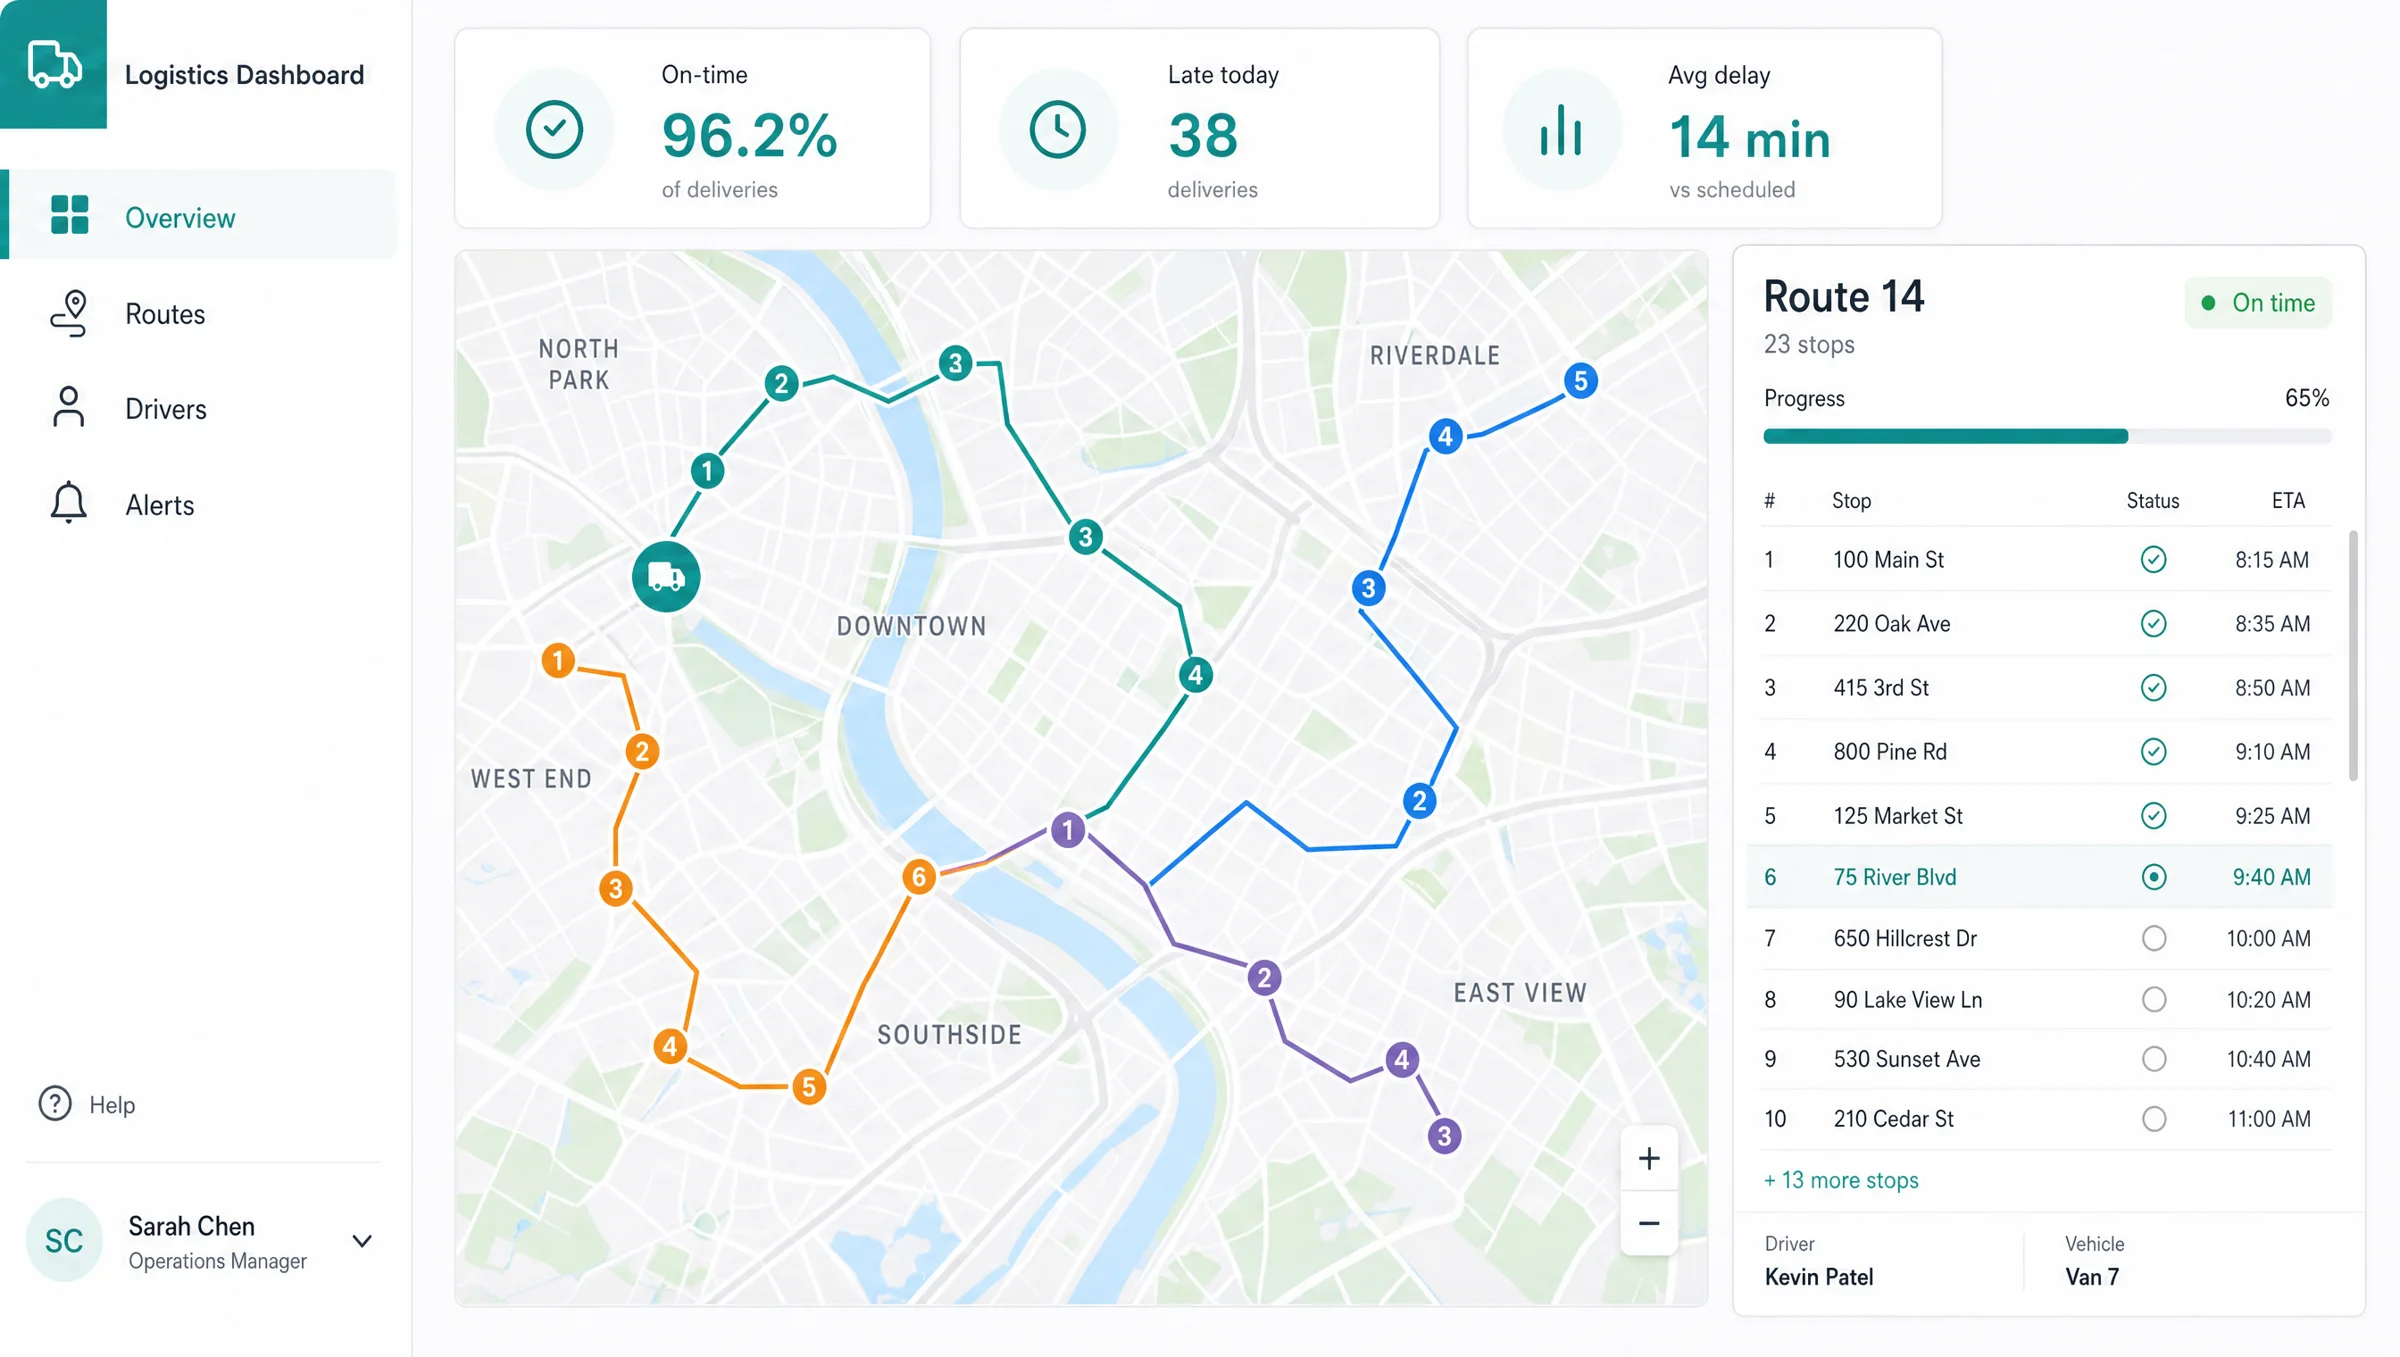
Dispatchers at Rutby's six depots watched up to 140 routes on one map. Late vans showed up as a red dot after the delay had already happened, usually when a customer called.
How the ranking works
Each route gets a score from its first three stops, and the five most likely to run late sit on the first screen. The map stayed, one click away.
The pushback
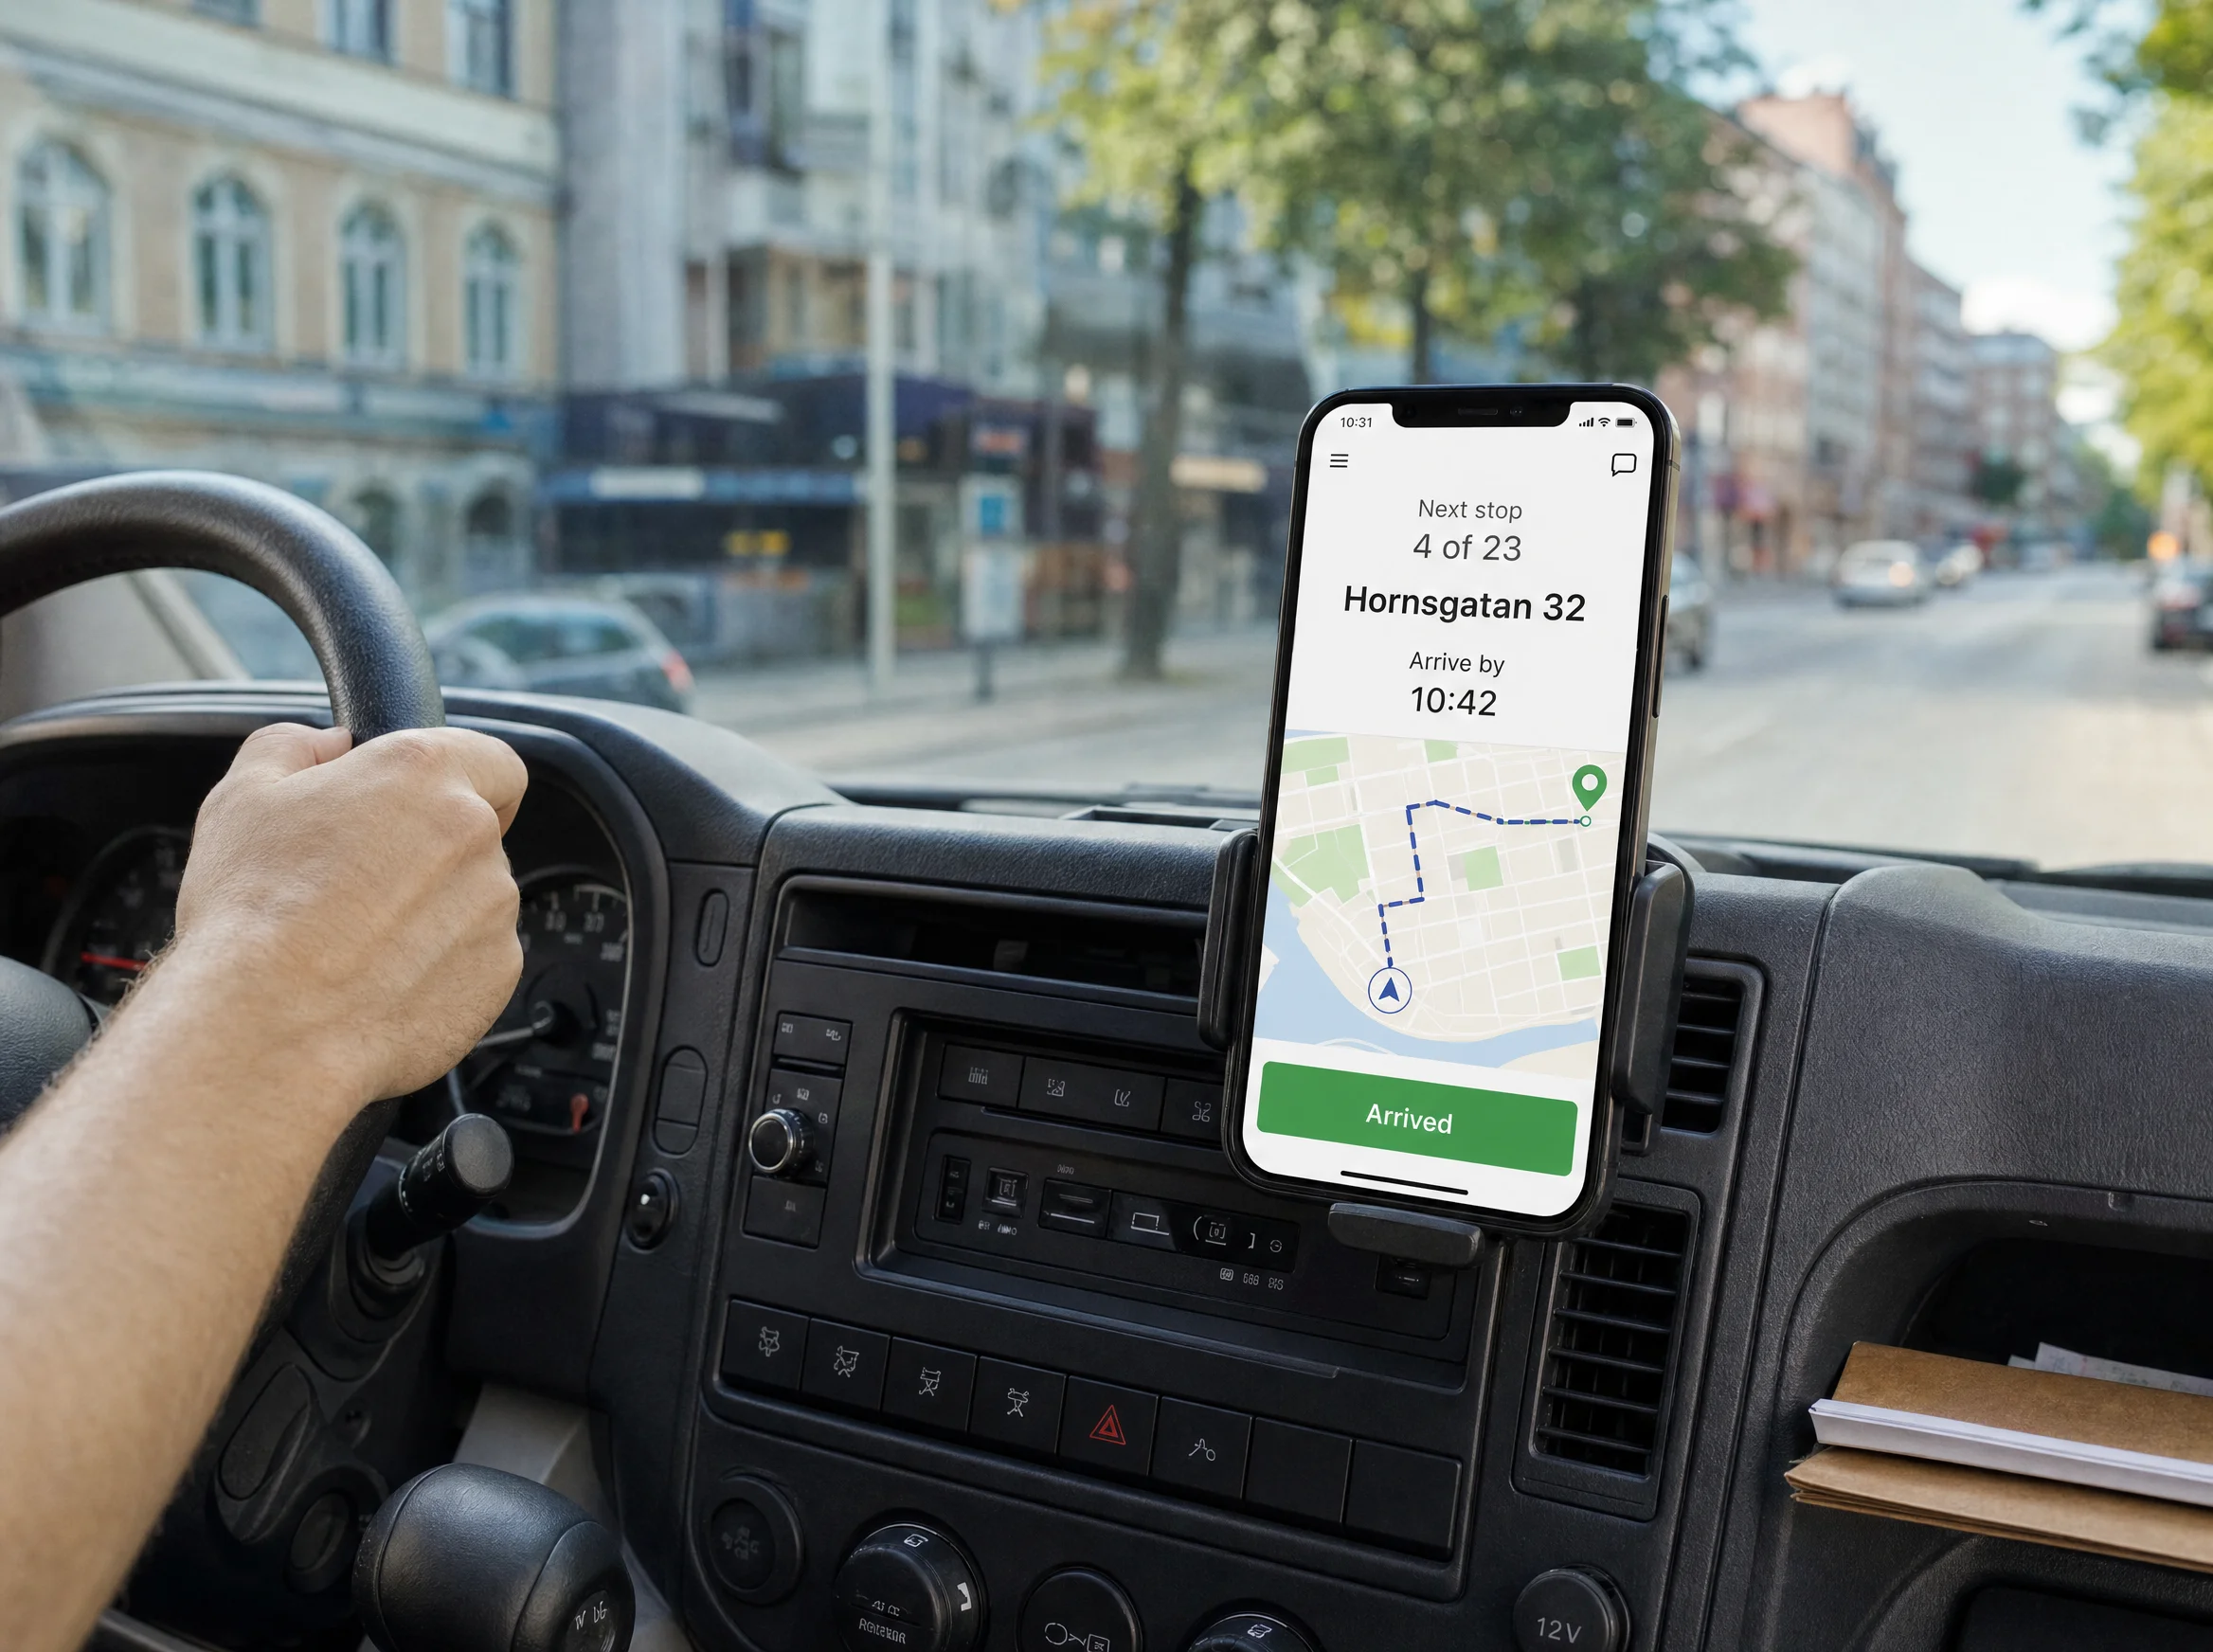
Two depots wanted the full list back on day one. We added a pinned view for them and kept the ranked list as the default everywhere else.
The result
On-time deliveries went from 88% to 96% over five months across 1,200 drivers. Calls from customers about late parcels fell by a third, from about 300 a week to 200.

Remix Lede for free